Top industrial markets restack, reflecting a changing nation By Mark Russo
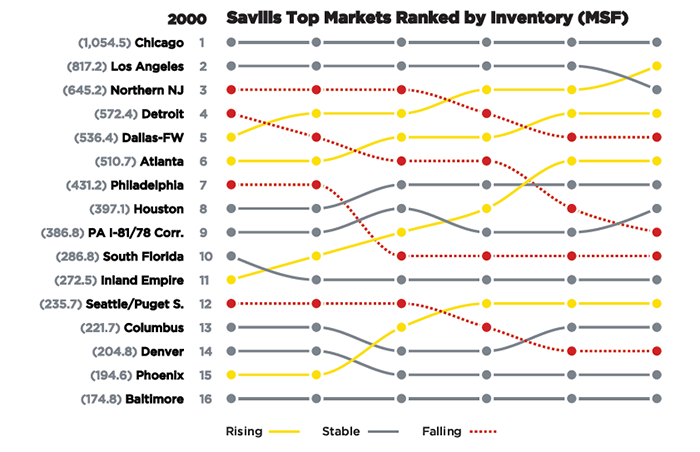
Three massive hubs long dominated the US industrial landscape: Los Angeles, Chicago and Northern New Jersey. These markets, which service the country’s largest metropolitan regions, historically held the highest positions in terms of sheer square footage, trade volume flowing through ports and railyards and capital invested. However, since the turn of the 21st century, the industrial real estate landscape has been shifting, reflecting transformational changes in demographics and technology, which the pandemic further accelerated. Savills Research examined changes in size rankings of 16 top markets beginning in 2000, when online sales represented a mere one percent of overall retail and 14 years before Florida surpassed New York as the third most populous state.
 The notable changes in market inventory rankings since 2000 reflect the following major themes:
Population migration to Sun Belt
Demand for industrial property is closely tied to consumption, which is about people, a fact that has become even more pronounced as the ecommerce penetration rate has grown to 14.5 percent of retail sales. Occupiers, and the developers trying to attract them, are following the rooftops, and those households have been migrating southward, drawn by warmer climates and lower living costs. One top destination has been Texas, which has seen its resident population grow by nearly 40 percent in two decades. Mirroring this change, the Dallas-Fort Worth industrial market added 348 million square feet (msf) of building inventory, causing it to rise from number five to the second-largest market in the US, now exceeding Los Angeles. Similar stories unfolded in other Sun Belt cities, including Atlanta and Phoenix, where warehouse inventory grew by 53 percent and 78 percent, respectively, since 2000. Despite the construction boom, vacancy ranges from 3.9 percent to 6.2 percent in these markets.
Land scarcity in core markets
Despite being in high demand, a limited amount of land in the densely developed coastal markets has been pushing developers and tenants seeking space into adjacent markets. The Inland Empire and Pennsylvania’s I-81/78 corridor started as lower-cost alternatives to the expensive and famously tight Los Angeles and Northern New Jersey markets but have been coming into their own. The Inland Empire more than doubled in size since 2000, growing from 272 msf to 666 msf, and is now the 6th-largest market. However, they too are running out of space, with the Inland Empire now seeing a 1.2 percent vacancy rate, the lowest of any major market.
Redevelopment of obsolete product
The biggest slide in size ranking occurred in the Rust Belt capital of Detroit. While the market did grow slightly since the turn of the century, it went from the nation’s 4th largest to 9th place. This is unsurprising given the sluggish population growth in the region. Also at play is the demolition of older manufacturing buildings, which reduces the overall inventory. Roughly 54 percent of the buildings in Detroit are more than 40 years old and do not offer what most tenants are looking for in terms of ceiling height and layout, conditions that are not easily remedied and result in their seeing the wrecking ball. Looking ahead, onshoring and the growth of new industries like EV manufacturing are reasons why Detroit and other Midwest markets may start expanding again in the future, but with new inventory up to modern specs. 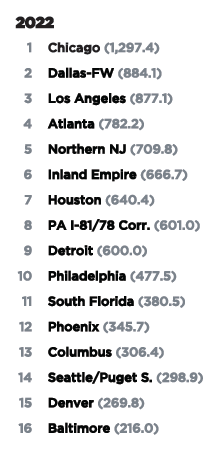
Beyond the 16 top markets analyzed in this study, other future top industrial hubs have emerged. For example, Savannah, Georgia, which was barely a dot on the map in terms of warehousing, has grown to become a nearly 100 msf market and is forecast to double in size by 2027. Other up-and-coming industrial clusters, such as Las Vegas, Salt Lake City and Greenville, South Carolina, are increasingly on the lists of tenants and investors as the industrial real estate landscape continues to evolve in response to a changing nation.
Looking ahead in 2023, construction activity is expected to slow as new projects become tougher to finance as well as lease due to the impact of higher interest rates on the capital and leasing markets. This will translate into a pause in the aforementioned trends around expansion of market inventories and relative rankings. However, when the cycle begins again, similar patterns are likely to resume but with some new twists. The reaction to the Covid-era supply chain crisis will likely be one of them as occupiers diversify locations including ports of entry to build resilience. One thing is clear: in a changing world, the most important industrial hubs of yesterday will not necessarily be the top markets of tomorrow.
Sources: U.S. Census, U.S. Department of Commerce, Savills Research
Note: For this analysis, market inventory has been standardized to include all industrial property over 10,000 square feet and may differ from figures reported in other Savills Research reports.
Mark Russo
www.savills.com
Mark Russo is Senior Director, Head of Industrial Research at Savills. Savills helps organizations find the right solutions that ensure employee success. Sharply skilled and fiercely dedicated, the firm’s integrated teams of consultants and brokers are experts in better real estate. With services in tenant representation, workforce and incentives strategy, workplace strategy and occupant experience, project management, and capital markets, Savills has elevated the potential of workplaces around the corner, and around the world, for 160 years and counting.